The Tech Stack Directory
The tools news publishers actually use, with adoption rates and user satisfaction, category by category. Tech Stack 2026 · France · 452 tools
Web analytics Most used : AT Internet / Piano Analytics (54 %)13 tools · Browse category →Mobile app analytics Most used : Adjust (19 %)8 tools · Browse category →Subscription management Most used : GLI / Ediis / Magellan (24 %)14 tools · Browse category →Landing pages Most used : In-house solution (49 %)12 tools · Browse category →Web paywall Most used : Poool Access (46 %)2 tools · Browse category →Mobile app paywall Most used : In-house solution (35 %)2 tools · Browse category →Payment service provider Most used : Stripe (43 %)14 tools · Browse category →Newsletters & emailing Most used : Brevo (ex-Sendinblue) (30 %)18 tools · Browse category →User feedback Most used : Typeform (30 %)11 tools · Browse category →On-site engagement Most used : Poool Engage (43 %)5 tools · Browse category →PDF reader Most used : Milibris (30 %)7 tools · Browse category →Moderation / UGC Most used : Netino by Webhelp (35 %)3 tools · Browse category →Push notifications Most used : Batch (51 %)6 tools · Browse category →Data visualization Most used : Looker Studio (Google Data Studio) (43 %)10 tools · Browse category →A/B testing Most used : AB Tasty (19 %)4 tools · Browse category →Games / Gamification Most used : In-house solution (16 %)7 tools · Browse category →SEO Most used : OnCrawl (27 %)17 tools · Browse category →
Editorial planning Most used : Outils Google (Drive, Sheets, Calendar) (48 %)7 tools · Browse category →CMS Most used : In-house solution (19 %)13 tools · Browse category →Social media publishing Most used : Non.li (45 %)10 tools · Browse category →Live blogging Most used : In-house solution (23 %)5 tools · Browse category →Maps Most used : Google Maps (35 %)8 tools · Browse category →Editorial infographics Most used : Flourish (48 %)10 tools · Browse category →Speech-to-text Most used : Trint (19 %)11 tools · Browse category →Text-to-speech Most used : Podle (10 %)8 tools · Browse category →Proofreading & writing assistance Most used : Prolexis (61 %)6 tools · Browse category →
Front-end framework Most used : HTML/CSS/JS traditionnels (68 %)10 tools · Browse category →Back-end languages / frameworks Most used : Symfony (39 %)17 tools · Browse category →Mobile app languages Most used : Swift (42 %)8 tools · Browse category →E-commerce Most used : In-house solution (19 %)8 tools · Browse category →Web performance monitoring Most used : Google Lighthouse (42 %)17 tools · Browse category →Tag management system Most used : Google Tag Manager (58 %)5 tools · Browse category →CDN Most used : Cloudflare (32 %)7 tools · Browse category →Bot / crawler detection Most used : Cloudflare (23 %)7 tools · Browse category →Web application firewall Most used : Cloudflare (26 %)8 tools · Browse category →Hosting Most used : Amazon Web Services (AWS) (35 %)12 tools · Browse category →Database Most used : MySQL (39 %)10 tools · Browse category →Data warehouse Most used : BigQuery (39 %)9 tools · Browse category →Single sign-on Most used : Auth0 (32 %)5 tools · Browse category →Source code management Most used : GitHub (48 %)3 tools · Browse category →Project management Most used : Jira (55 %)11 tools · Browse category →Code assistant Most used : GitHub Copilot (48 %)5 tools · Browse category →LLMs embedded in products Most used : OpenAI (GPT) (42 %)6 tools · Browse category →LLM application framework / SDK Most used : In-house solution (10 %)2 tools · Browse category →AI agent orchestration Most used : n8n (13 %)5 tools · Browse category →Multi-model platform Most used : AWS Bedrock (19 %)6 tools · Browse category →Vector database Most used : OpenSearch (16 %)6 tools · Browse category →
Ad servers Most used : Google Ad Manager (74 %)7 tools · Browse category →Order management system (OMS) Most used : AdResa (Opper) (32 %)6 tools · Browse category →SSPs & ad networks Most used : Google Ad Manager (AdX) (68 %)23 tools · Browse category →Header bidding wrapper Most used : Prebid.js (53 %)5 tools · Browse category →Data clean room Most used : LiveRamp Clean Room (26 %)6 tools · Browse category →DMP / CDP Most used : Mediarithmics (37 %)5 tools · Browse category →Alternative IDs Most used : Utiq (53 %)6 tools · Browse category →Consent management platform (CMP) Most used : Didomi (63 %)6 tools · Browse category →Advertpayment Most used : ViewPay (26 %)1 tools · Browse category →Affiliate marketing Most used : Awin (21 %)11 tools · Browse category →Digital audio Most used : SoundCast (26 %)8 tools · Browse category →Contextual & cookieless targeting Most used : In-house solution (37 %)8 tools · Browse category →Connected TV (CTV) Most used : In-house solution (16 %)4 tools · Browse category →In-image Most used : Seedtag (16 %)2 tools · Browse category →Native advertising Most used : Outbrain (32 %)6 tools · Browse category →Dynamic creative optimization (DCO) Most used : AdsWizz (5 %)4 tools · Browse category →Ad verification Most used : IAS (58 %)3 tools · Browse category →Attribution Most used : oKube (Smart Traffic) (21 %)3 tools · Browse category →Carbon footprint measurement Most used : DK (53 %)4 tools · Browse category →Yield management & analytics Most used : Pubstack (42 %)5 tools · Browse category →Audio player Most used : Acast (21 %)5 tools · Browse category →Video player Most used : Dailymotion (47 %)7 tools · Browse category →
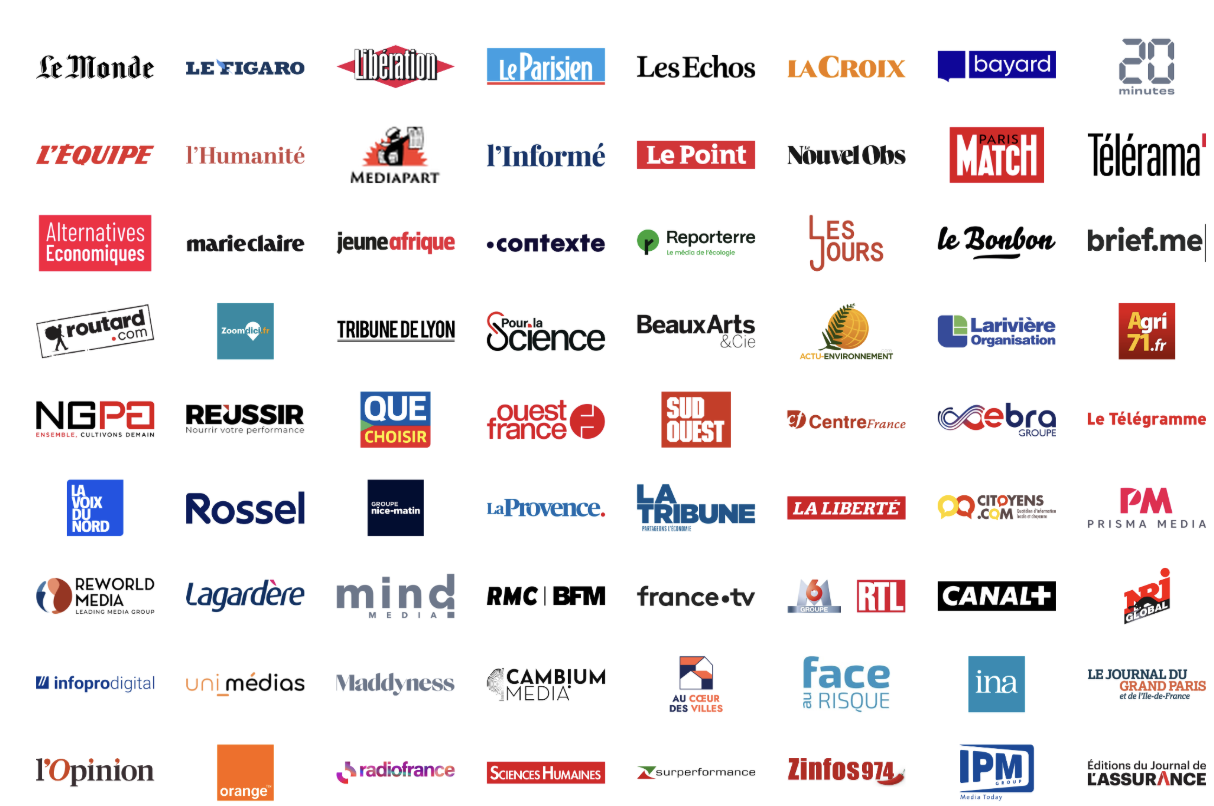
Who took part in the 2026 study?
The titles and groups whose marketing, editorial, technology and ad-sales teams described their stack. Individual answers remain anonymous.